By Domtria Simba M | July 2, 2016
Background Summary
This Shiny App is for searching and visualizing vFeed fully aggregated, cross-linked and standardized Vulnerability CVE Database that contains detective and preventive security information repository used for gathering vulnerability and mitigation data on the internet. The data set is from Toolswatch.org Github
There are six metrics used to calculate the exploitability and impact sub-scores of the vulnerability.:
- Access Vector – Access Complexity
- Authentication – Confidentiality
- Integrity – Availability
These sub-scores are used to calculate the overall base score.
Database Synopsis
library(sqldf);library(reshape2);library(rCharts)
db <- dbConnect(SQLite(), dbname="./vFeed.db" )
STATS <-dbReadTable(db, dbListTables(db)[42])
vfeedStats <- melt(STATS)
vfeedStats <- vfeedStats[-c(1,3),]
names(vfeedStats)[1]<-"Titles"
names(vfeedStats)[2]<-"Count"
p1<-rPlot(Count~Titles,color = 'Titles',data = vfeedStats,type = 'bar')
p1$guides(color = list(numticks = length((vfeedStats[,1]))),
          x = list(title="Titles", ticks = ''),
          y = list(title="Count")
)
p1$addParams(width = 1000, height = 650, title = "Title")
The database has a total of 42 tables. I used 5 tables( table[4], table[8], table[9],table[40], table[42] ) out of the 43 tables.
List of Tables and Row Count
vFeed Application
Click to Load CWE Titlesthis shiny does not load data right away. Continue to navigate site CWE Titles are being loaded.Dashboardto see six metrics used to calculate the exploitability and impact sub-scores of the vulnerability for selected years and risk score.Click to View CVE Categoryto see General CVEs and Web Application related CVEs.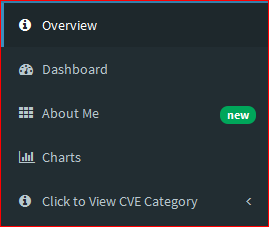
SelectionsYou can clear all titles and select only those you want to view.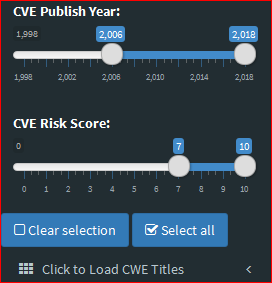
Enjoy!!!!