By Domtria Simba M | February 10, 2016
Analysis
The scope of this analysis is to understand which chemical properties influence the quality of Red wine.The following data set was utilized in this analysis. This tidy data set contains 1,599 red wines with 11 variables on the chemical properties of the wine.
Load the Data and required Libraries
library(ggplot2)
library(grid)
library(gridExtra)
library(psych)
library(dplyr)
library(data.table)

# Local data csv file
dataWine <- "../../static/data/wineQualityReds.csv"

# Name of unzipped Directory
dirFile <- "UCI HAR Dataset"

# Download the dataset (. ZIP), if it does not exist
if (file.exists(dataWine) == FALSE) {
  # Sometimes changing https to http and skip method="curl"
  # in the download.file works if having problems with curl
  fileUrl <- "https://s3.amazonaws.com/udacity-hosted-downloads/ud651/wineQualityReds.csv"
  download.file(fileUrl, destfile = "../../static/data/wineQualityReds.csv")
}

redwine <- fread(dataWine)
Summary of the Data Set
##  [1] "V1"                   "fixed.acidity"        "volatile.acidity"
##  [4] "citric.acid"          "residual.sugar"       "chlorides"
##  [7] "free.sulfur.dioxide"  "total.sulfur.dioxide" "density"
## [10] "pH"                   "sulphates"            "alcohol"
## [13] "quality"
## Classes 'data.table' and 'data.frame': 1599 obs. of 13 variables:
## $ V1 : int 1 2 3 4 5 6 7 8 9 10 ...
## $ fixed.acidity : num 7.4 7.8 7.8 11.2 7.4 7.4 7.9 7.3 7.8 7.5 ...
## $ volatile.acidity : num 0.7 0.88 0.76 0.28 0.7 0.66 0.6 0.65 0.58 0.5 ...
## $ citric.acid : num 0 0 0.04 0.56 0 0 0.06 0 0.02 0.36 ...
## $ residual.sugar : num 1.9 2.6 2.3 1.9 1.9 1.8 1.6 1.2 2 6.1 ...
## $ chlorides : num 0.076 0.098 0.092 0.075 0.076 0.075 0.069 0.065 0.073 0.071 ...
## $ free.sulfur.dioxide : num 11 25 15 17 11 13 15 15 9 17 ...
## $ total.sulfur.dioxide: num 34 67 54 60 34 40 59 21 18 102 ...
## $ density : num 0.998 0.997 0.997 0.998 0.998 ...
## $ pH : num 3.51 3.2 3.26 3.16 3.51 3.51 3.3 3.39 3.36 3.35 ...
## $ sulphates : num 0.56 0.68 0.65 0.58 0.56 0.56 0.46 0.47 0.57 0.8 ...
## $ alcohol : num 9.4 9.8 9.8 9.8 9.4 9.4 9.4 10 9.5 10.5 ...
## $ quality : int 5 5 5 6 5 5 5 7 7 5 ...
## - attr(*, ".internal.selfref")=<externalptr>## V1 fixed.acidity volatile.acidity citric.acid
## Min. : 1.0 Min. : 4.60 Min. :0.1200 Min. :0.000
## 1st Qu.: 400.5 1st Qu.: 7.10 1st Qu.:0.3900 1st Qu.:0.090
## Median : 800.0 Median : 7.90 Median :0.5200 Median :0.260
## Mean : 800.0 Mean : 8.32 Mean :0.5278 Mean :0.271
## 3rd Qu.:1199.5 3rd Qu.: 9.20 3rd Qu.:0.6400 3rd Qu.:0.420
## Max. :1599.0 Max. :15.90 Max. :1.5800 Max. :1.000
## residual.sugar chlorides free.sulfur.dioxide total.sulfur.dioxide
## Min. : 0.900 Min. :0.01200 Min. : 1.00 Min. : 6.00
## 1st Qu.: 1.900 1st Qu.:0.07000 1st Qu.: 7.00 1st Qu.: 22.00
## Median : 2.200 Median :0.07900 Median :14.00 Median : 38.00
## Mean : 2.539 Mean :0.08747 Mean :15.87 Mean : 46.47
## 3rd Qu.: 2.600 3rd Qu.:0.09000 3rd Qu.:21.00 3rd Qu.: 62.00
## Max. :15.500 Max. :0.61100 Max. :72.00 Max. :289.00
## density pH sulphates alcohol
## Min. :0.9901 Min. :2.740 Min. :0.3300 Min. : 8.40
## 1st Qu.:0.9956 1st Qu.:3.210 1st Qu.:0.5500 1st Qu.: 9.50
## Median :0.9968 Median :3.310 Median :0.6200 Median :10.20
## Mean :0.9967 Mean :3.311 Mean :0.6581 Mean :10.42
## 3rd Qu.:0.9978 3rd Qu.:3.400 3rd Qu.:0.7300 3rd Qu.:11.10
## Max. :1.0037 Max. :4.010 Max. :2.0000 Max. :14.90
## quality
## Min. :3.000
## 1st Qu.:5.000
## Median :6.000
## Mean :5.636
## 3rd Qu.:6.000
## Max. :8.000Observations from the Summary
The range for fixed acidity is quite high. It has a minimum of 3.8, maximum of 15.9 and a median of 7.90.
The median sugar of red wine is 2.20.
The median quality of red wine is 6.0.
The median pH of red wine is 3.31.
The median alcohol content of red wine is 10.20.
Understand the correlation of all variables
I will start by looking at all variables to get a sense of how they correlate to each other within the data set.
Scatterplot Matrices Review
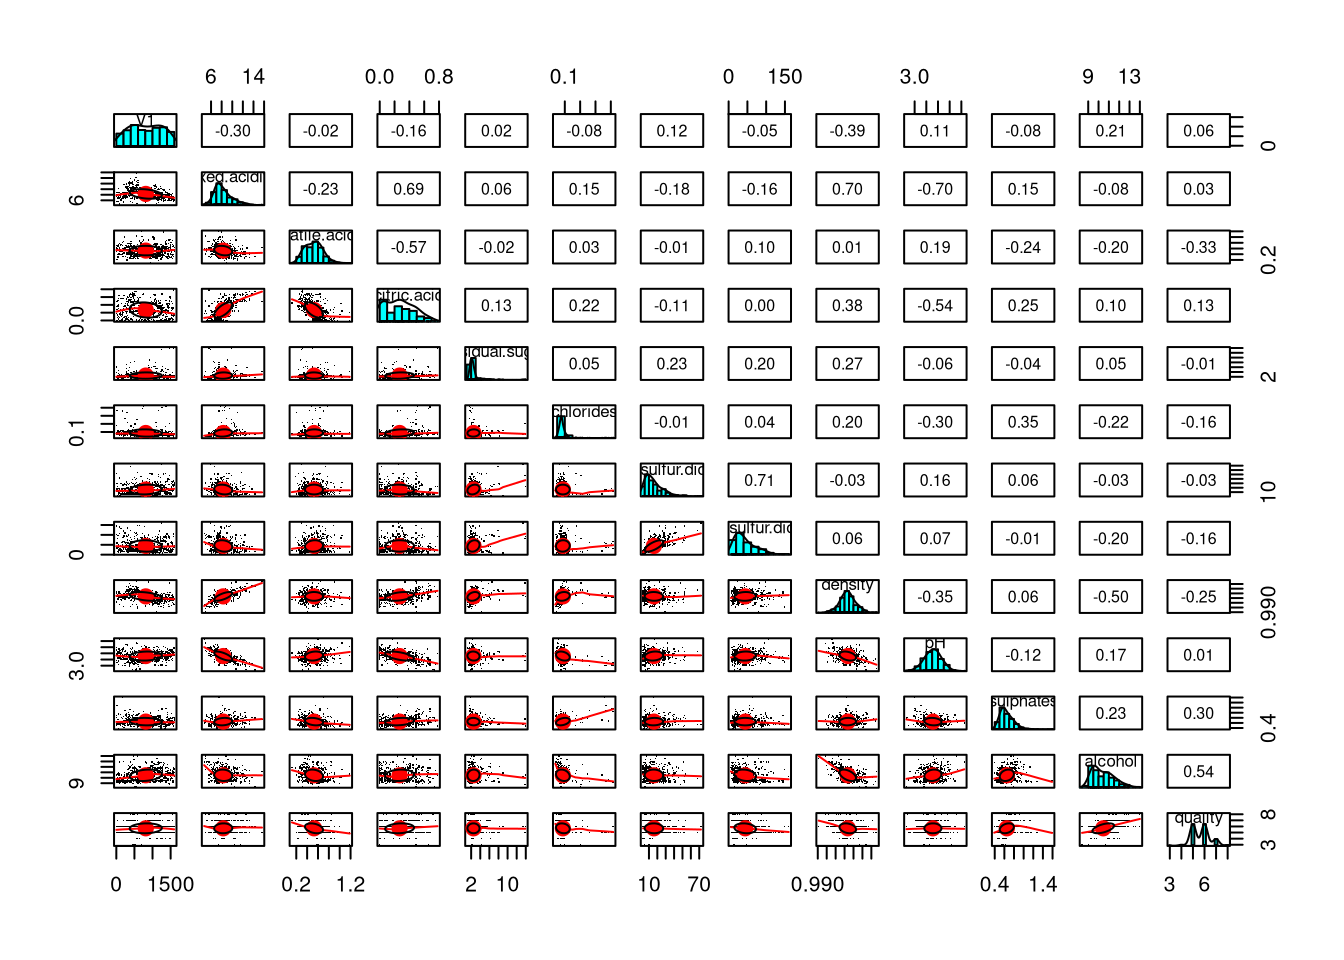
Pairs.panel output indicates the following correlation behavior:
Fixed Acidity
Noticeable positive correlation with citric acid, density and sulphates. Negative correlation with pH and Alcohol
Sulphates
Positive correlation with quality, citric acid and chlorides. Negative correlation with pH and residual sugar
pH
Positive correlation with Alcohol and Volatile Acidity. Negative correlation with fixed acidity, residual sugar, chlorides and Total SO2
Alcohol
Positive correlation with pH and quality. Negative Correlation with density, chlorides, total and free so2
Quality
Positive correlation with alcohol and sulphates. Negative correlation with density,chlorides,volatile acidity
Based on pairs.panel scatterplot matrices, I will further explore the following components: fixed acidity, pH, sulphates, density, quality and alcohol.
### Distribution analysis key components
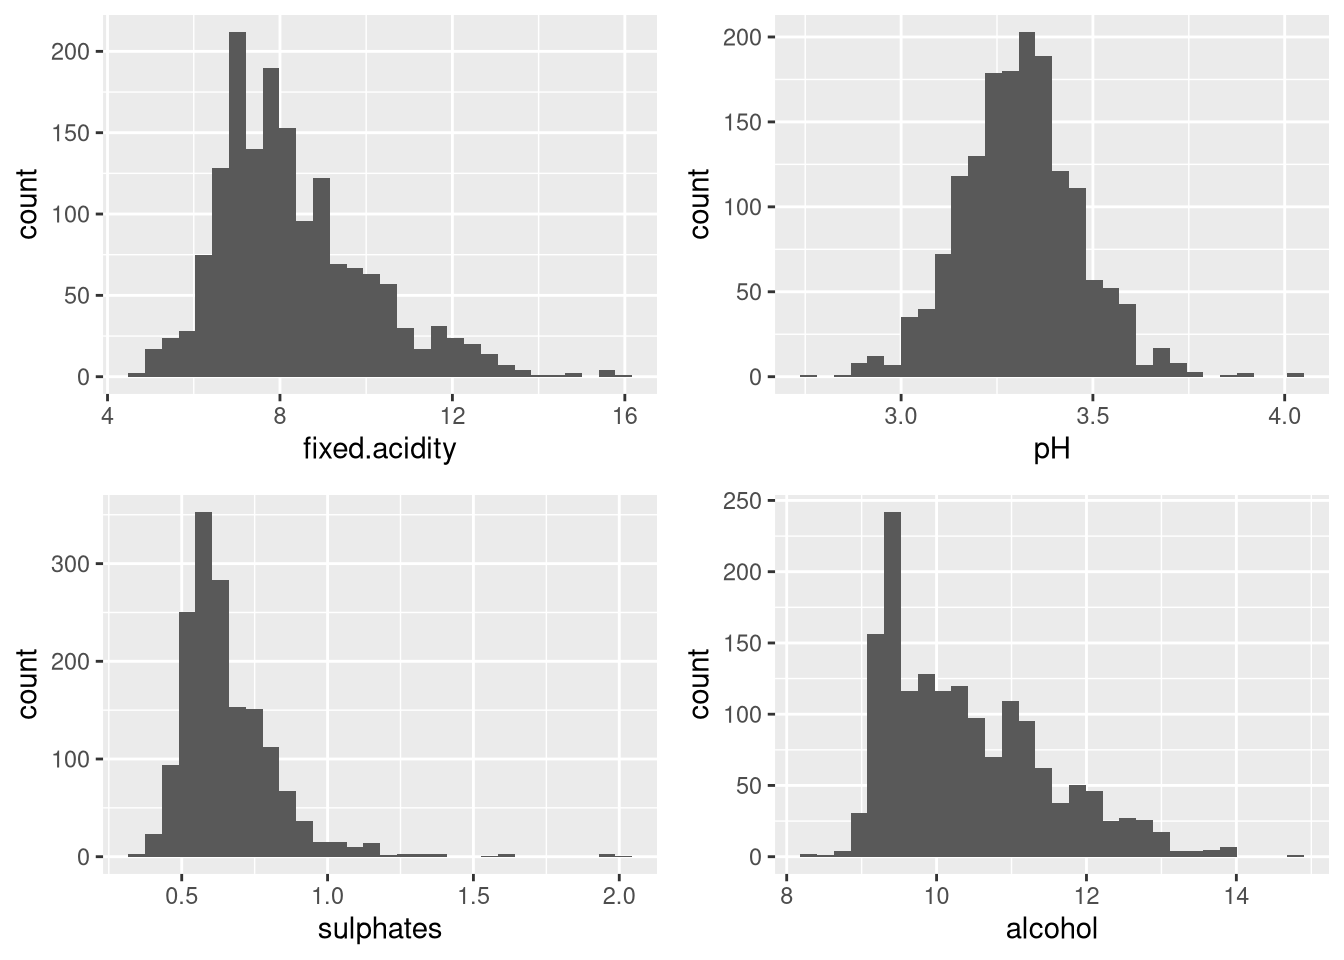
The following observations were obtained from the above plot:
- The fixed acidity value seems to display a normal distribution between 5.0 and 10.
- The pH value seems to display a normal distribution between 3.0 and 3.5.
- The sulphates seems to have a slight right skew with a single peak around 0.6.
- The alcohol content seems to be right skewed and varies from 8 to 14 with many peaks in the distribution.
- None of these distribution have any outliers.
A similar distribution analysis for quality is given below:
### Quality Distribution
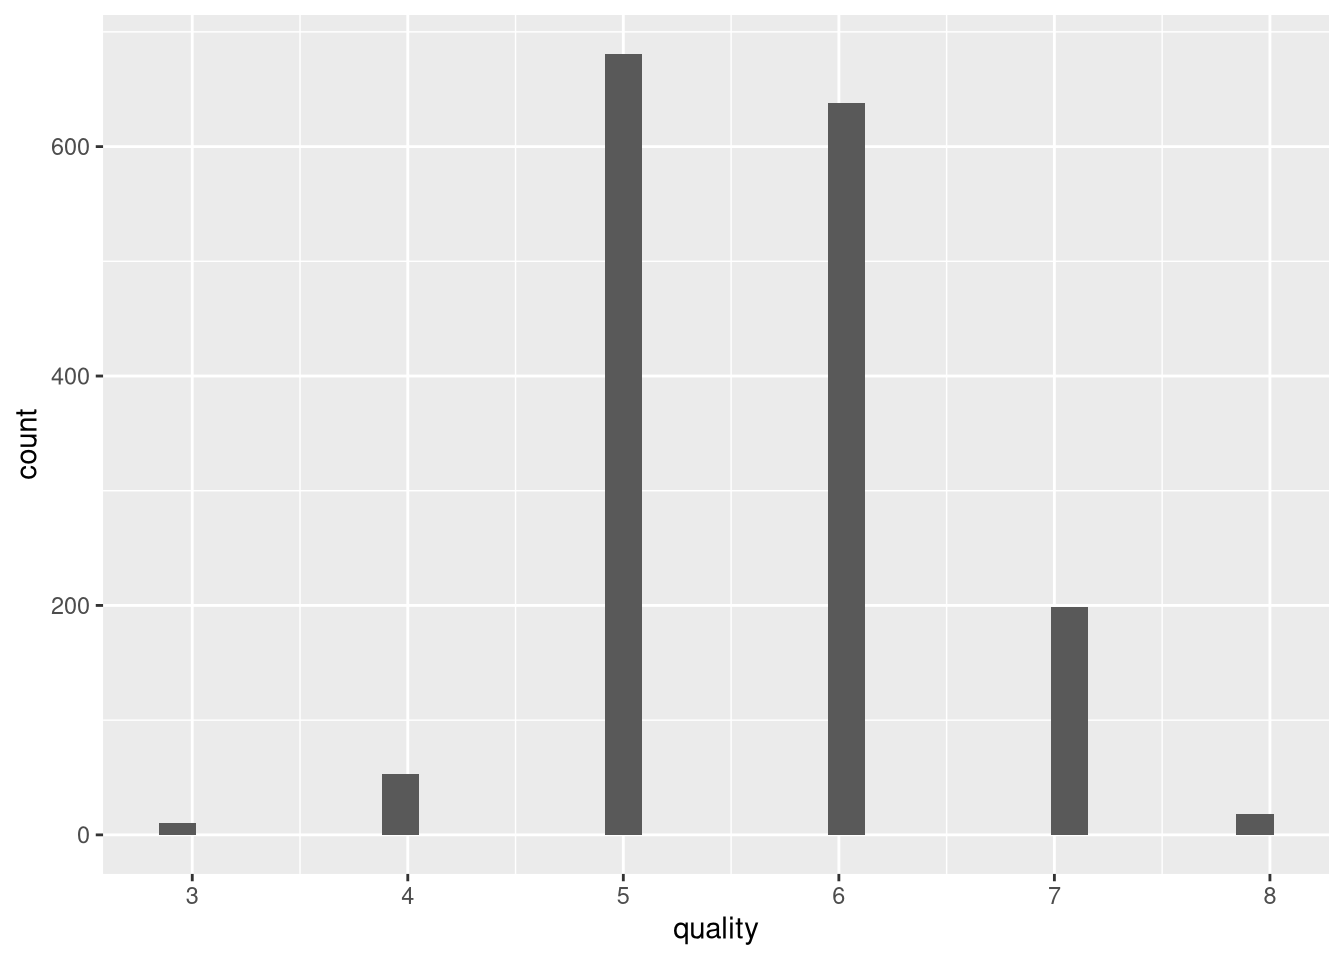
The spread for the quality of red wine exhibits a normal distribution with a peak at quality rating of 5.
Scatterplot Review
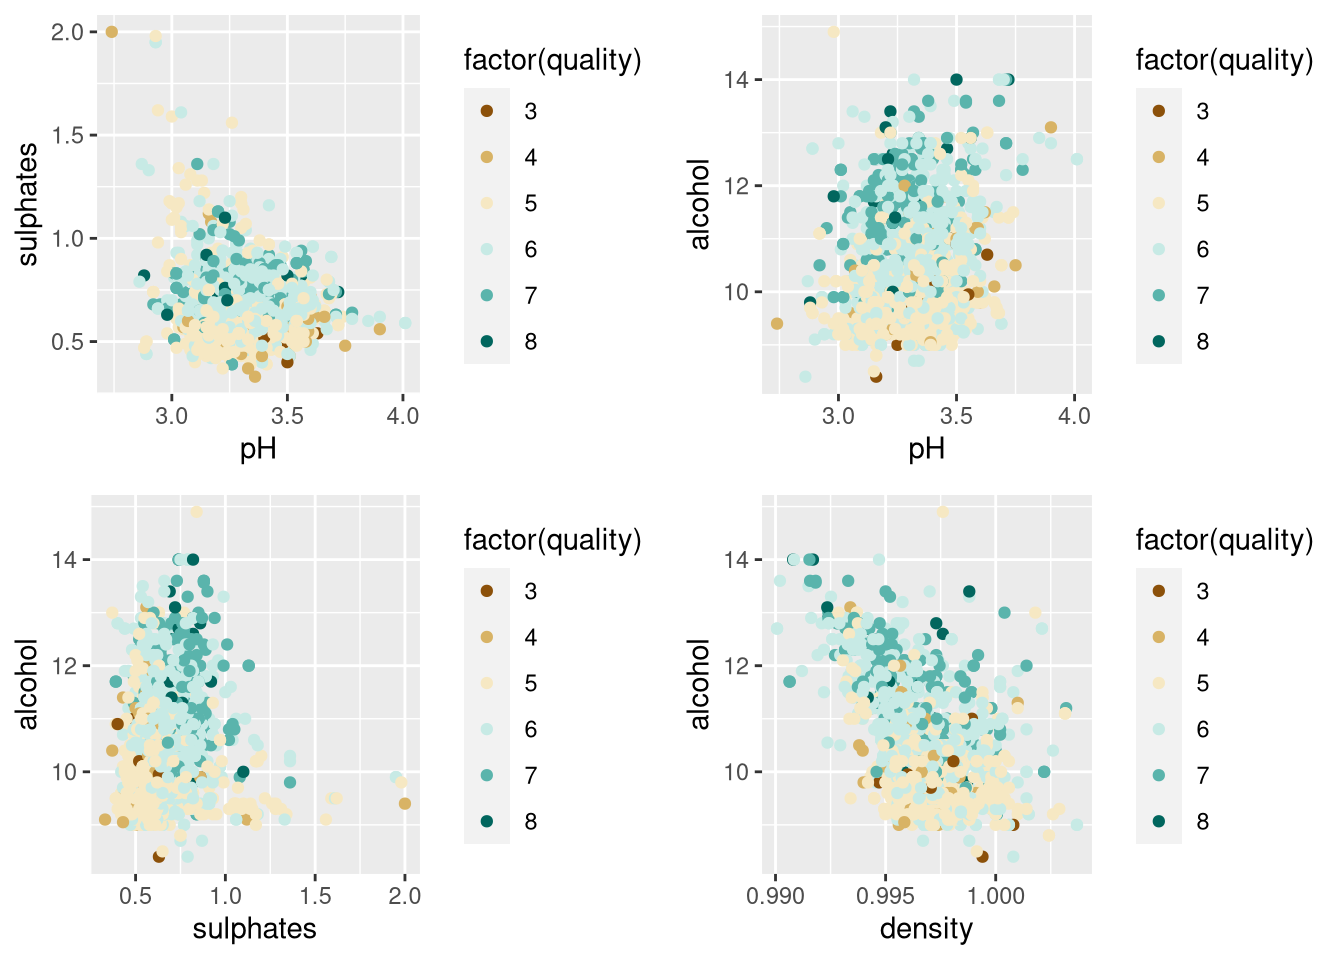
- There is an interesting observation that as quality rating increases, red wine alcohol and PH increases.
- Another observation is quality and alcohol increase between 0.75 to 1.0 contents of sulphates.
- Quality of wine increased as density decreased at above alcohol content of 10.
First, I am going to explore some of those variables that had negative correlation with each other.
Does alcohol have a negative correlation with density?
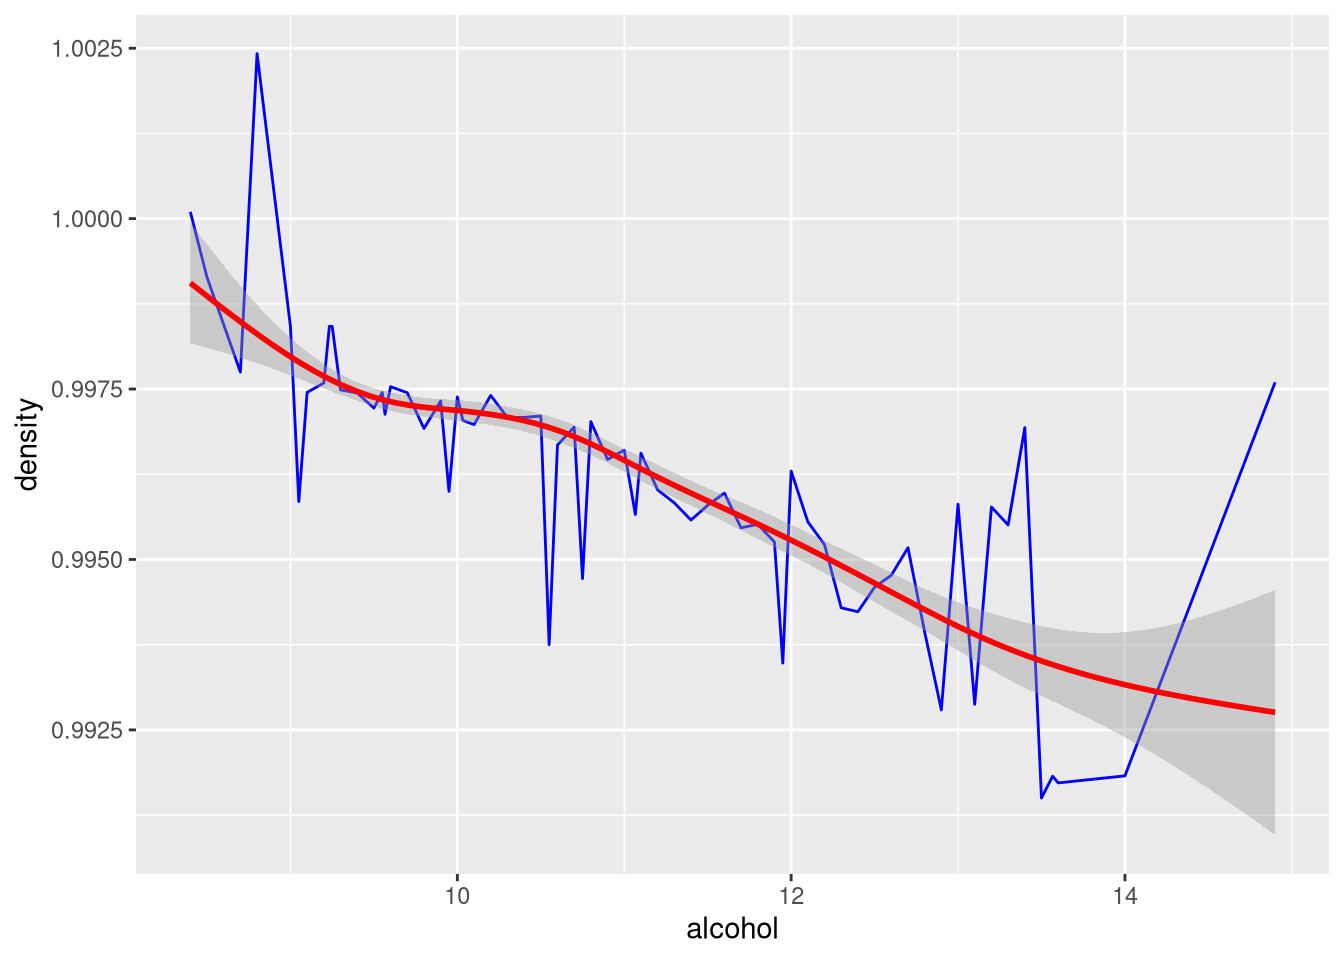
As expected, the more Alcohol content, the less dense the liquid becomes.
Does alcohol have a negative correlation with total sulfur dioxide?
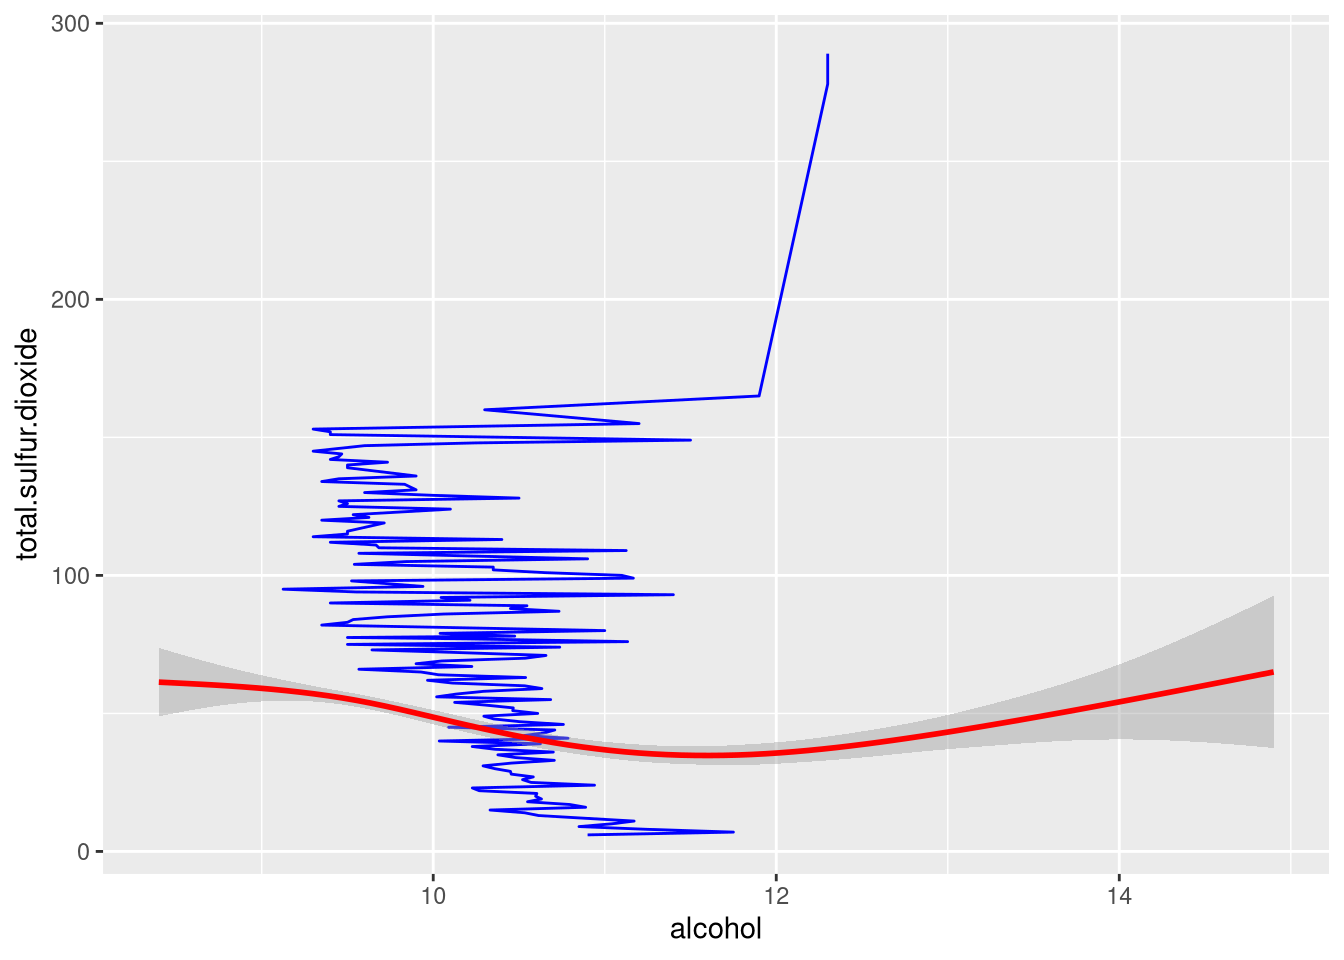
This was not expected. Value of total sulfur dioxide decreases, and starts to increase at Alcohol content of around 12.
Does pH have a negative correlation with fixed acidity?
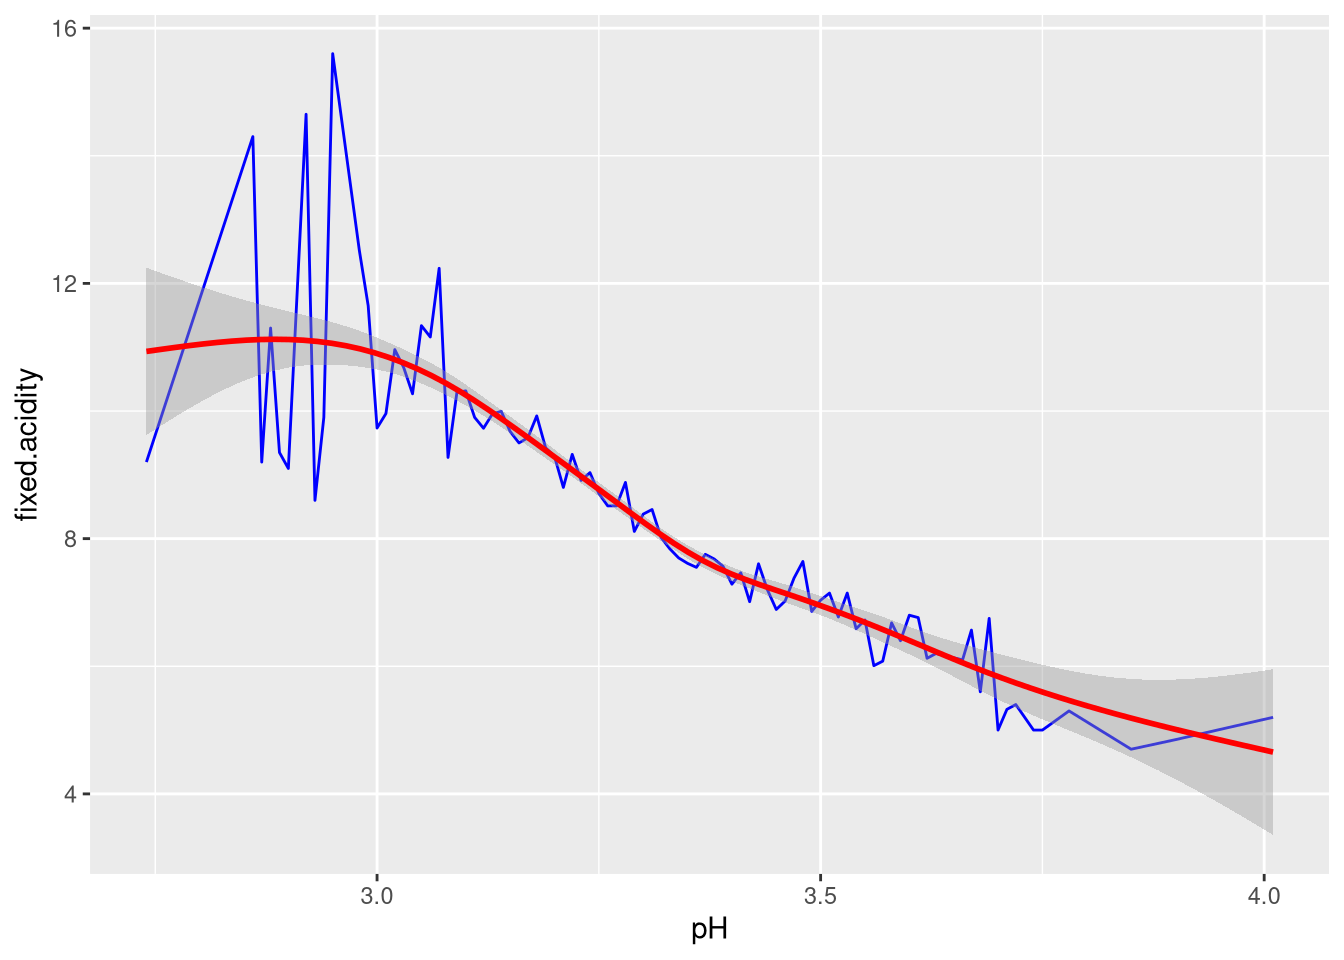
As expected in red wine, fixed acidity decreases as PH increases.
Does pH have a negative correlation with sulphates?
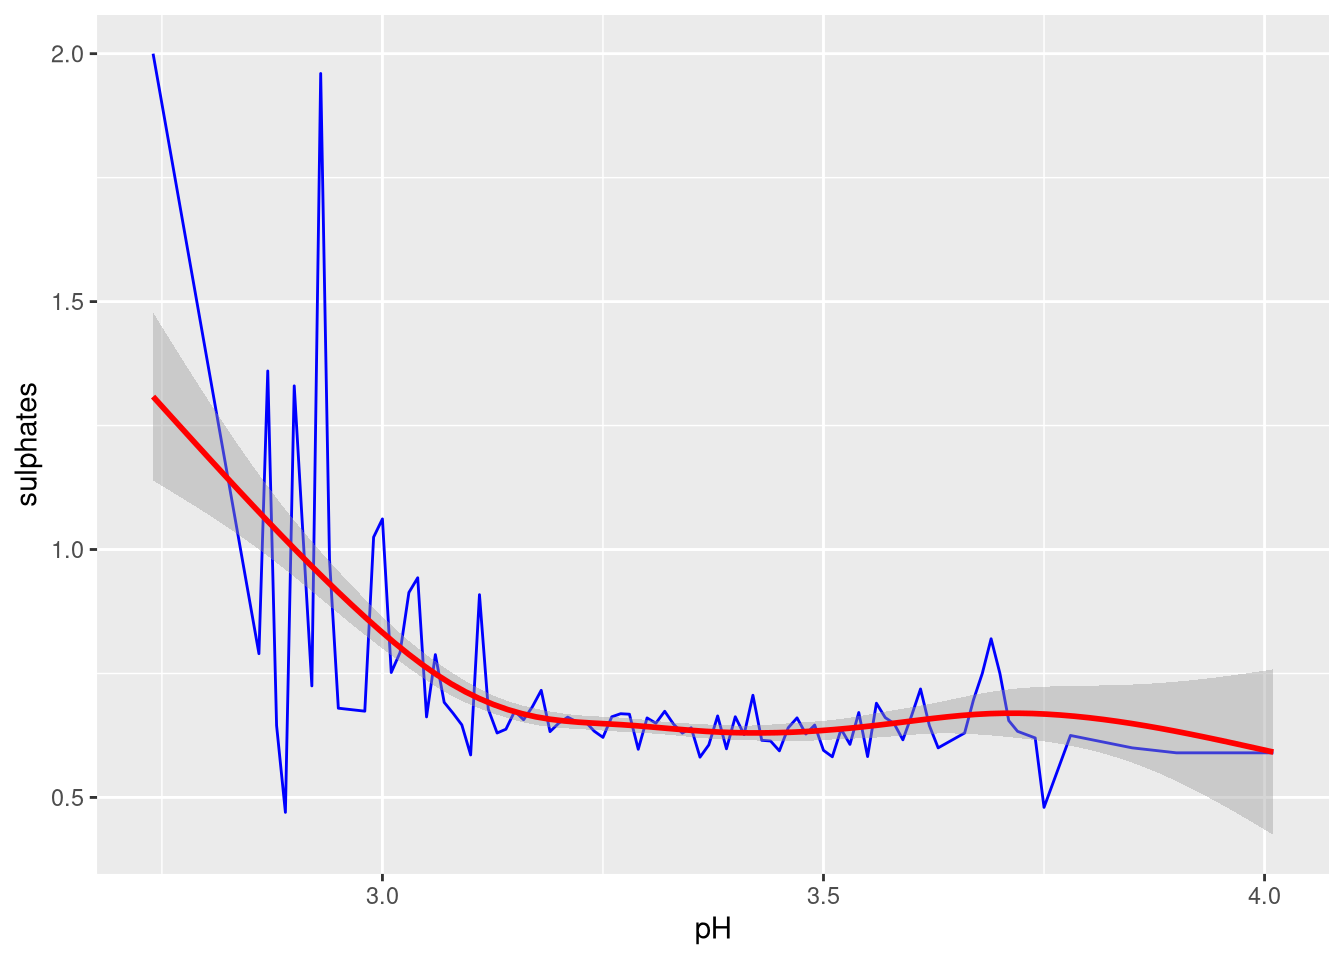
As expected in red wine, sulphates decrease as PH increases.
Second, I am going to explore some of those variables that had positive correlation with each other.
Do sulphates have a positive correlation with quality?
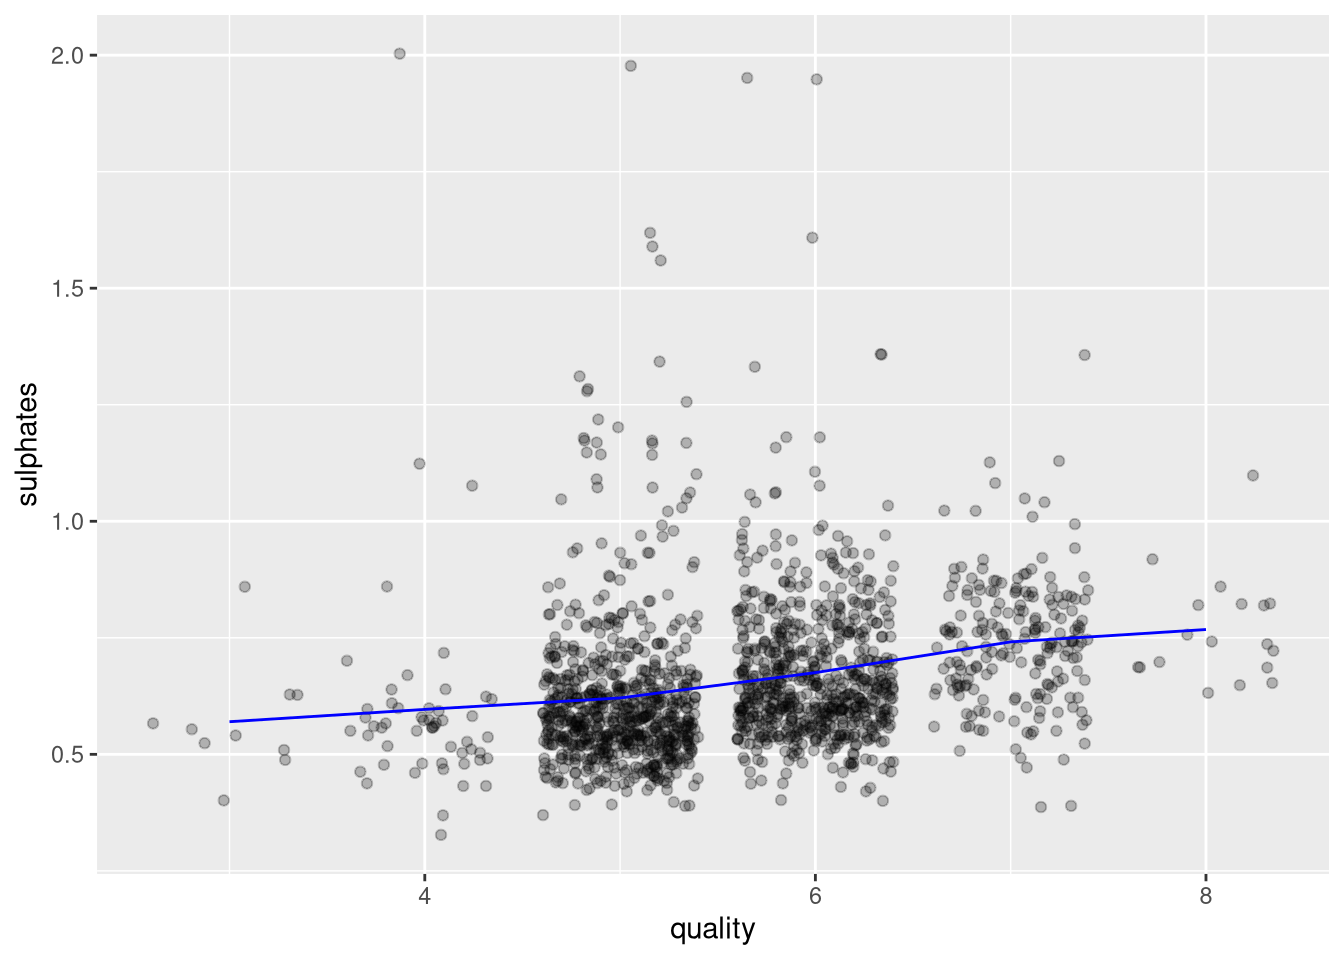
As expected Sulphates increase as quality increases.
Does alcohol have a positive correlation with quality?
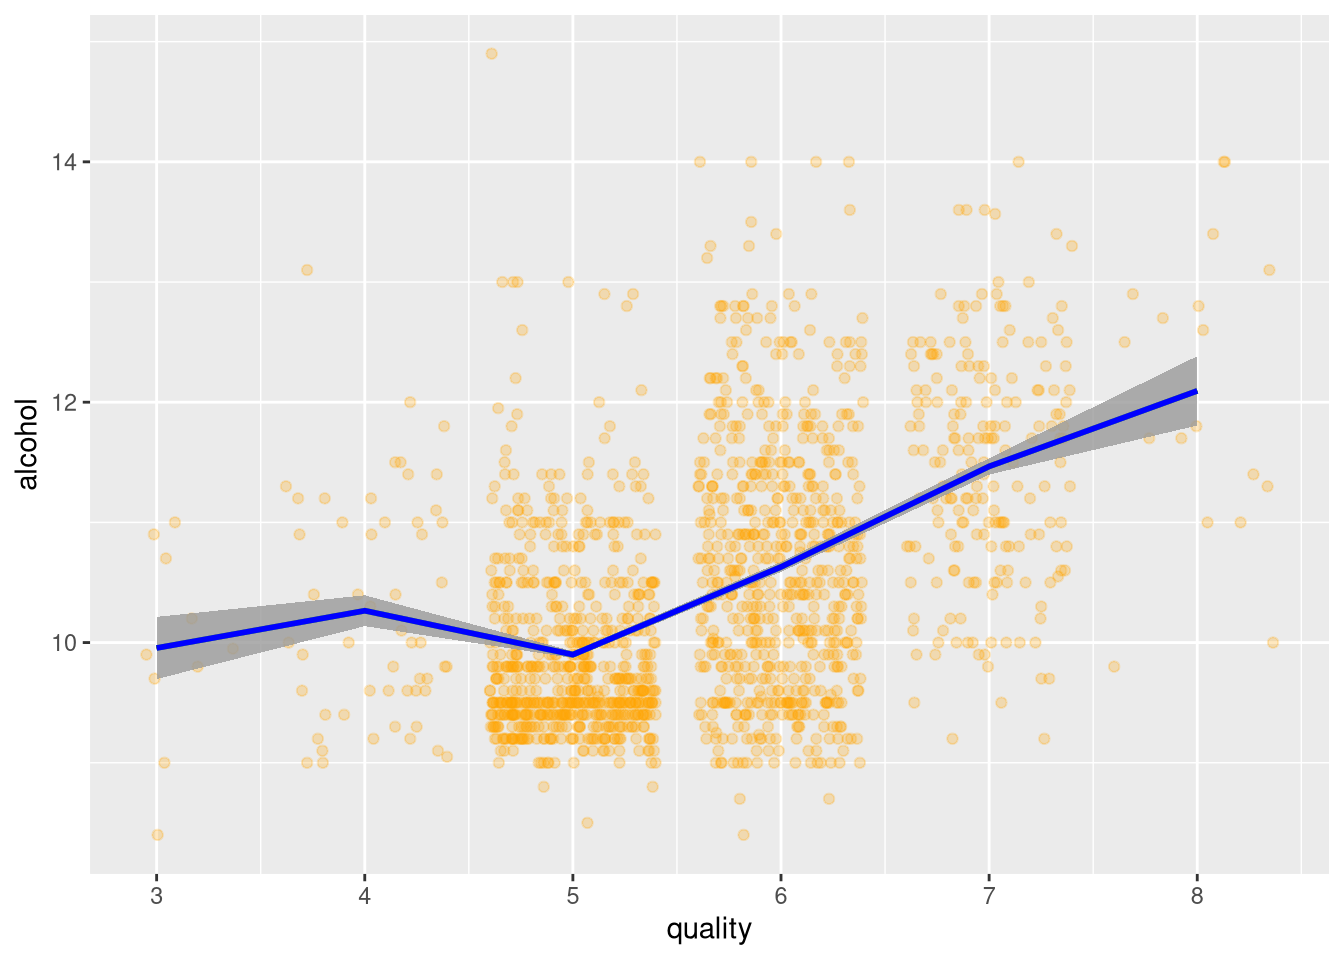
As expected, quality increased as alcohol content increased.
Does alcohol and density have any effect on quality?
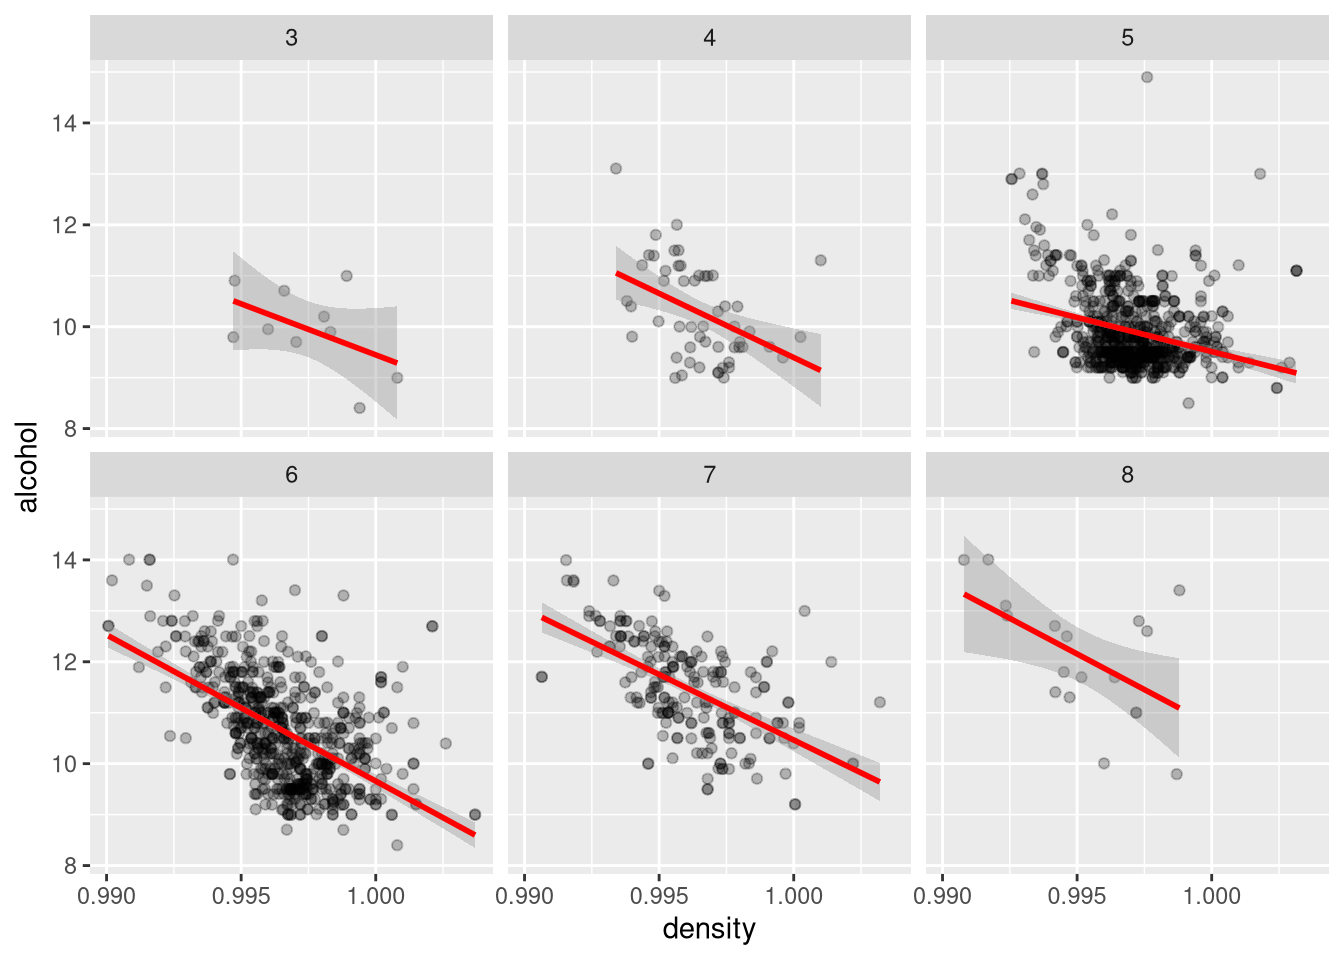
As expected there is a negative correlation between density and alcohol based on the slope for all quality ratings. Effects on quality by alcohol and density is clearly represented in quality rating 6 because it has the steepest negative slope.
Does pH and fixed acidity have any effect on quality?
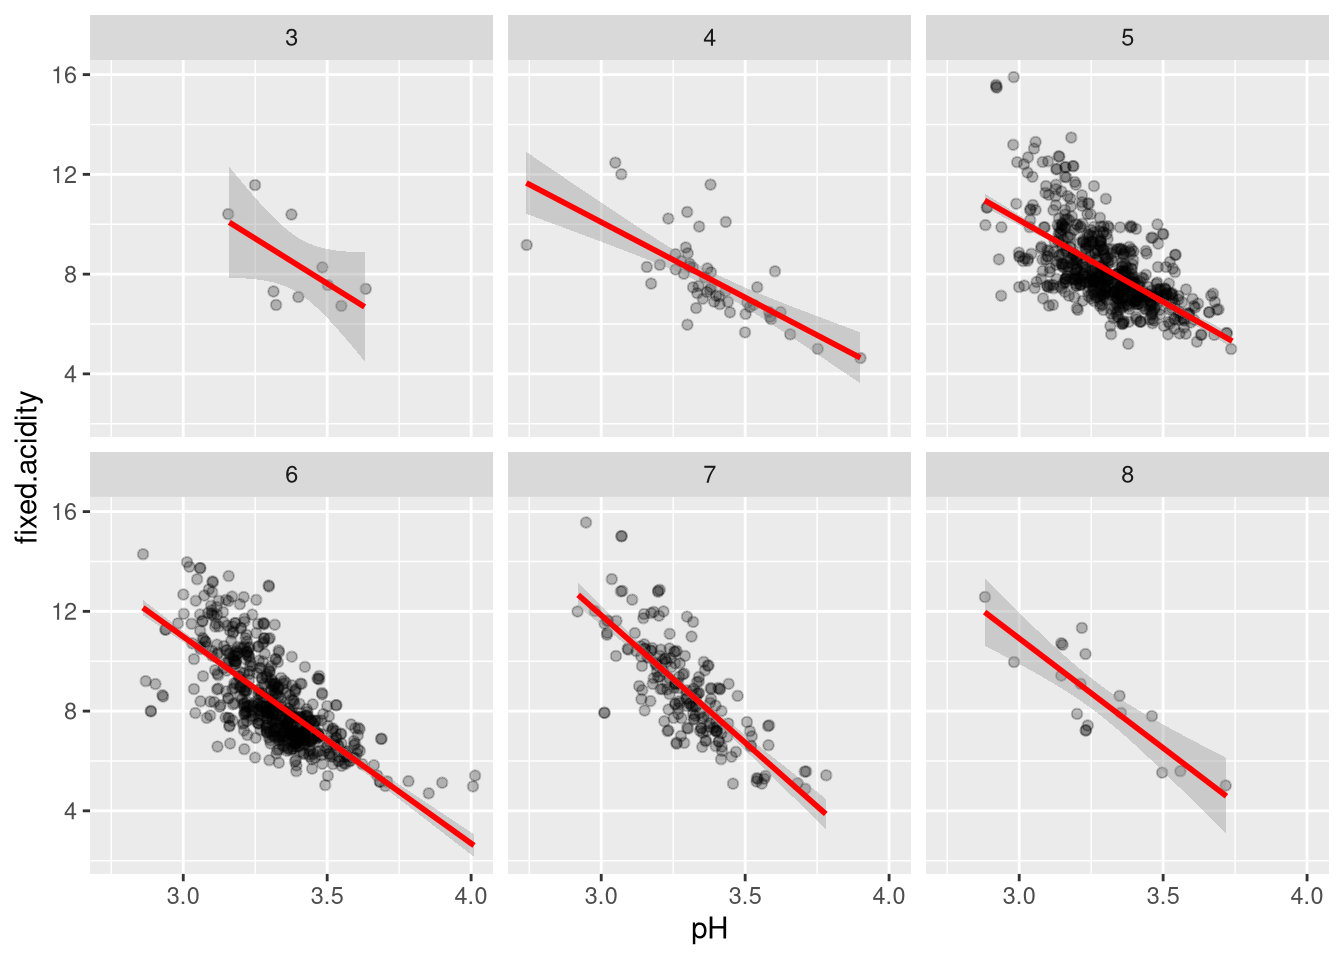
At quality rating 5, 6 and 7 I see the highest concentration of fixed acidity and pH interaction. I also notice that they are both at pH range of 3.0 - 3.75 and fixed acidity range of 4 - 14. As expected the acidity levels decrease as pH levels increase. However, the steepest negative slopes are seen in quality rating 6,7 and 8
Does pH and sulphates have any effect on quality
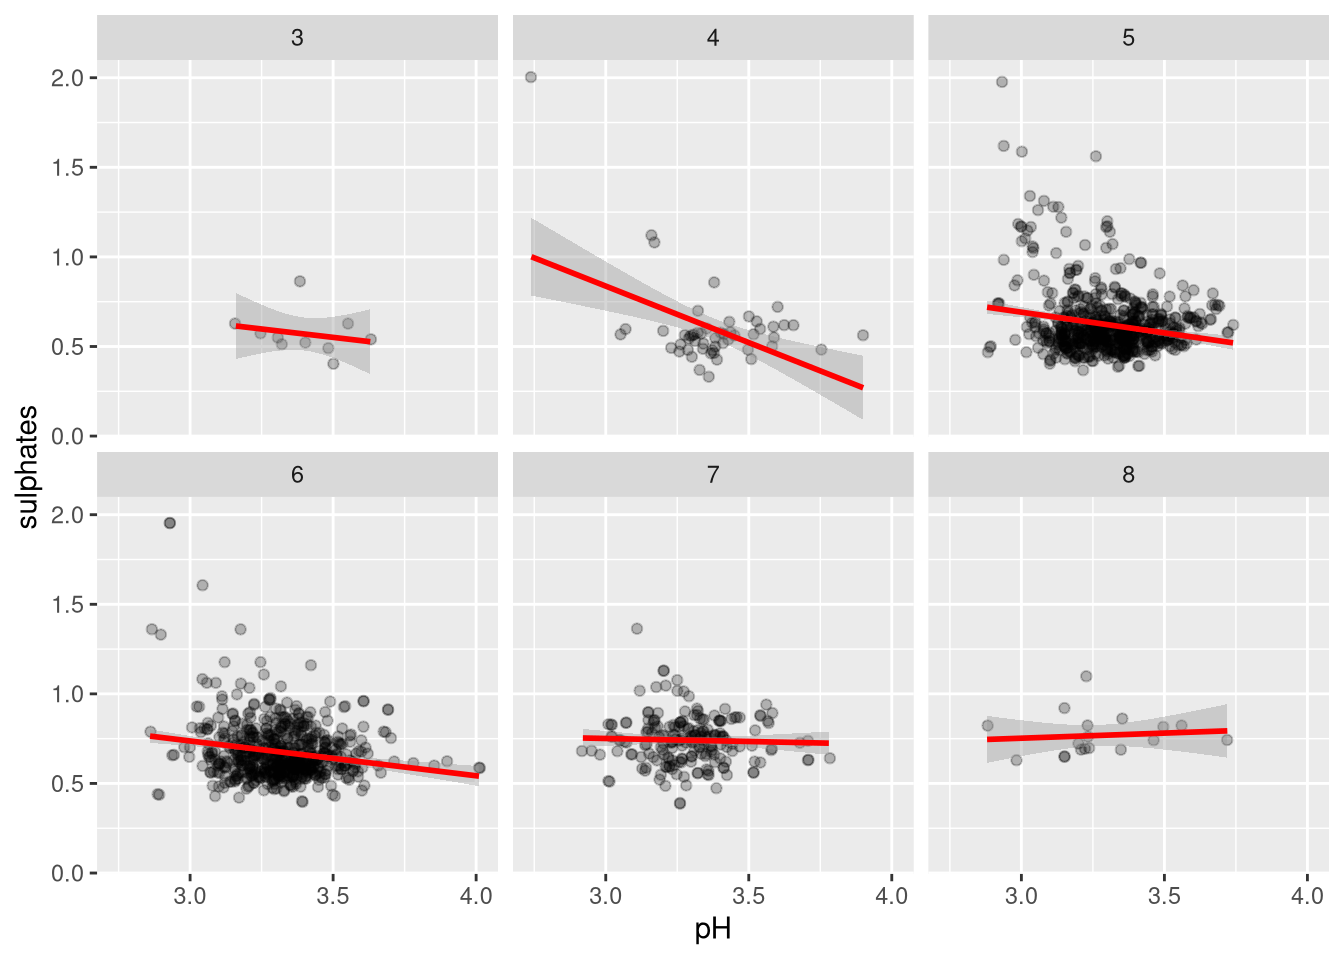
The general trend is that sulphates decline as pH increases. For quality rating 5 and 6, I do not see a steep negative slope of sulphates as pH increases. I also see a very noticeable trend in quality rating 7 and 8. There is no noticeable decline in sulphates as pH increases. I can conclusively say that on higher quality rating, wine sulphates stay the same as pH increases.
Final Plots and Summary
Final Plot One
Does alcohol % by volume have any effect on quality?
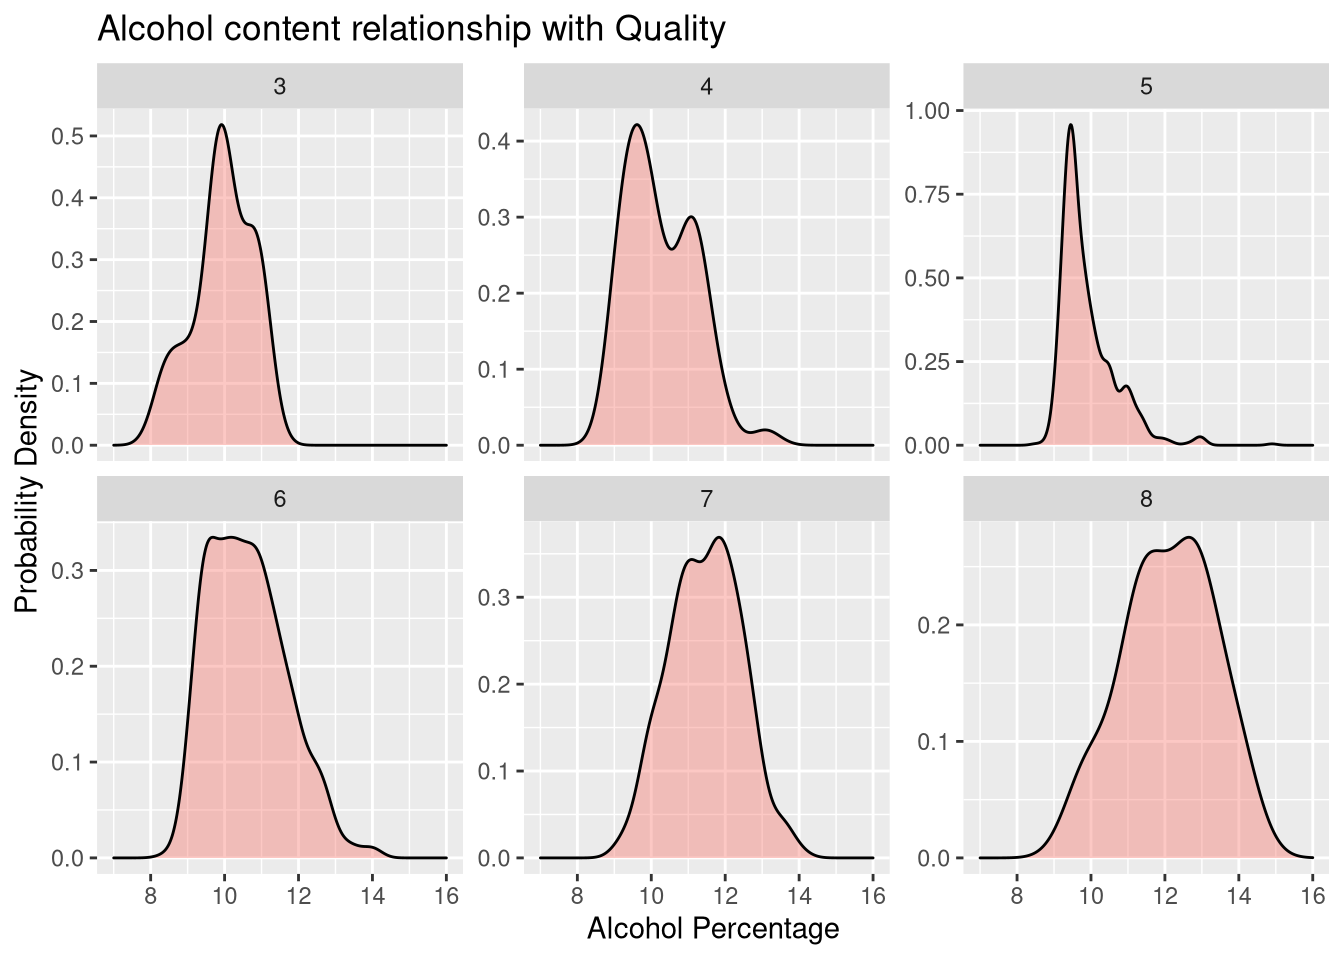
From the above analysis plot, there seems to be a relation between Alcohol content and quality in terms of the spread. That relationship is very strong in quality rating 6,7 and 8. However, there was an unexpected observation of higher alcohol probability in quality rating 3 and 5. My expectation was higher quality rating has higher alcohol volume.
Final Plot Two
Does pH and fixed acidity have any effect on quality?
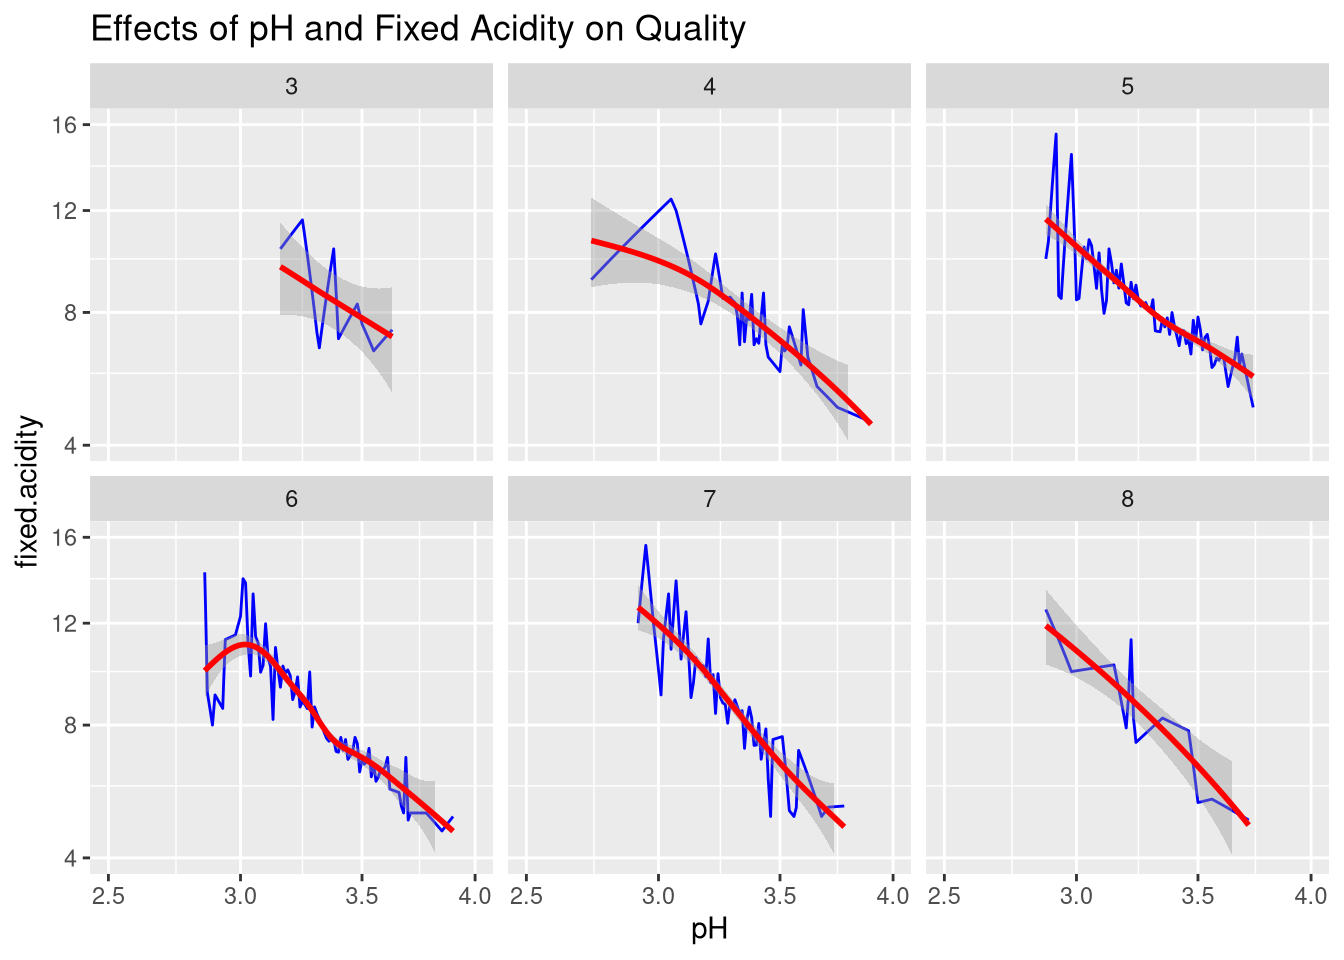
From the above analysis plot, there does not seem to be any special relations between pH values, fixed acidity and quality. All quality rating showing that pH values increase as fixed acidity decrease.
Final Plot Three
Does fixed acidity, pH, sulphates, alcohol have any effect on quality?
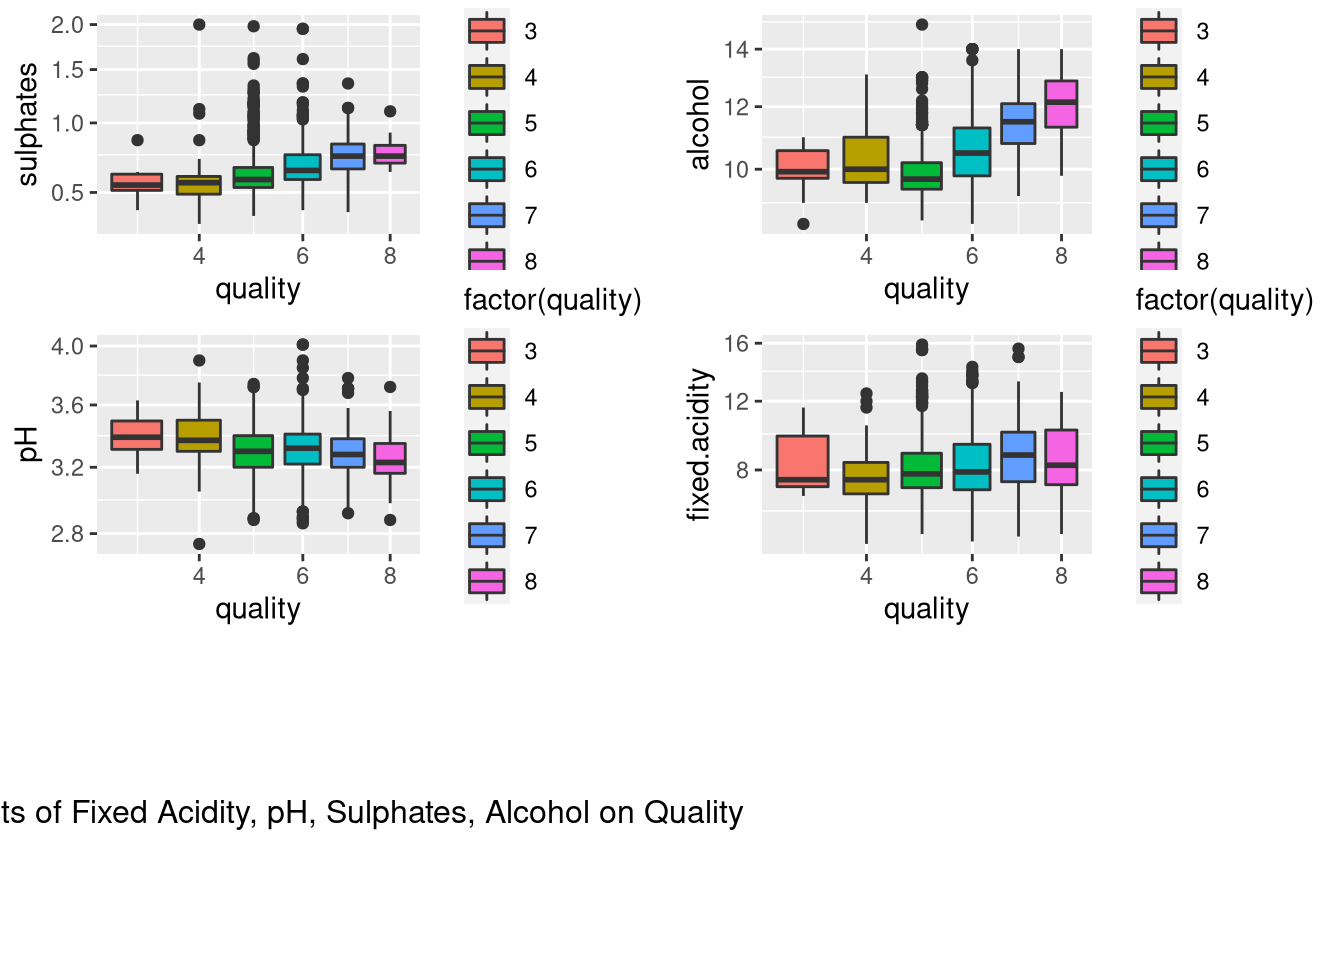
From the above boxplot analysis, sulphates and alcohol seem to increase as quality increases. pH values seem to decrease as quality increases. However, an interesting observation was that fixed acidity does not seem to really change as quality increases, except at quality rating 7.
Reflection
The red wine data set contains “1599 instances and 11 attributes of a red variant of the Portuguese”Vinho Verde" wine from around 2009“[1]. I had no understanding of wine when I started exploring this data set. I started out by doing some research on wine making process. After reading a wine production paper by Linda Bisson. I learned that”wine quality was very much subjective"[2].
That information helped me focus on 11 input variables based on physicochemical tests. “Quality is an output variable based on sensory data”[1]. As a first step, I wanted to understand how each of these chemicals interact and correlate with each other. I understood what pH, acidity, alcohol and citric acid were. However, I did not know much about chlorides, density, sulfur dioxide and sulphates. I had to do a lot of reading and research to understand how those chemicals affect quality.
At some point, as I was looking at the EDADataOptions file. I realized that there was a link to a text file which describes the variables and how the data was collected. That text file had descriptions of the attributes and that gave me a better understanding of the variables.
Alcohol content
I knew alcohol content is an important parameter considered when a buyer purchases any alcoholic product. My analysis tried to unravel relationship of alcohol content with pH values, sulphates, fixed acidity etc and the impact to quality.
pH value
I knew pH was important,but not sure how. After research, I learned that the pH of the juice at harvest is also an important variable. Wine pH will impact the nature of microorganisms that can persist in the fermentation and subsequently in the wine. Juice pH typically ranges from 3.0 to 3.8 under ideal conditions.
Fixed acidity
I knew too much acidity was not good. However, as for its contribution to wine, I had no knowledge. After research, I learned that acidity level of the grapes at harvest is very important to the structure of the wine as well as to the composition of the finished wine. Acids contribute sourness, while both acidity and pH influence tartness.
Sulphates
Based on my research, “Sulphates are anti-inflammatory and anti-depressant. They are needed for making stomach acid and digestive enzymes, so that we can break down the food we eat into useful components. They keep the gut wall healthy, so fragments of food that are too large cannot pass through. If they did, it would lead to the production of antibodies, and to allergies. It is also said to detoxify chemicals in foods and drugs, chemicals made by the body and others from the environment”[3]. What was confusing was the text file with the description stated that, sulphates were an additive. Did that mean, they were added after wine was made? Or did these sulphates occur naturally in the soil which grapes were grown in?
Sulfur dioxide (Free and Total)
Sulfur dioxide has always been a debatable topic due to the allergic reactions associated with it.
Upon learning all this information, I decided to investigate how if at all those chemicals influenced the quality rating of the red wine.
Some of the learnings from the analysis were as follows:
- The understanding that Red Wine generally is good for you. The analysis proved that higher quality red wine exhibits a higher level of sulphates which are supposed to be good for you.
- Quality of red wine had a negative correlation to pH. This analysis did not answer what deterministic role pH plays for wine quality testing by wine experts.
- For health conscious buyers, red wine with lower and higher alcohol content exhibited higher SO2 content.
- Finally, I quote, “To sum up, judging a wine on just two properties is rather simplistic. There are other factors to consider, for example age”[4].