By Domtria Simba M | February 28, 2012
Introduction
In this project we analyze the ToothGrowth data set. The data set gives the results of an experiment to determine the effect of two supplements (Vitamin C and Orange Juice), each at three different doses (0.5, 1 or 2 mg) on tooth length in guinea pigs. The len variable gives the tooth growth, the supp variable gives the supplement type and the dose variable gives the supplement dose. We will perform an analysis to compare tooth growth by supp and dose.
Loading required libraries
# Required libraries
library(datasets)
library(gridExtra)
library(ggplot2)
require(graphics)
Load Data and Preprocessing
ToothGrowth <- ToothGrowth
ToothGrowth$dose <- as.factor(ToothGrowth$dose) # convert to factor
Basic dataset summary
str(ToothGrowth)## 'data.frame': 60 obs. of 3 variables:
## $ len : num 4.2 11.5 7.3 5.8 6.4 10 11.2 11.2 5.2 7 ...
## $ supp: Factor w/ 2 levels "OJ","VC": 2 2 2 2 2 2 2 2 2 2 ...
## $ dose: Factor w/ 3 levels "0.5","1","2": 1 1 1 1 1 1 1 1 1 1 ...summary(ToothGrowth)## len supp dose
## Min. : 4.20 OJ:30 0.5:20
## 1st Qu.:13.07 VC:30 1 :20
## Median :19.25 2 :20
## Mean :18.81
## 3rd Qu.:25.27
## Max. :33.90Perform some basic exploratory data analyses
plotbox(ToothGrowth)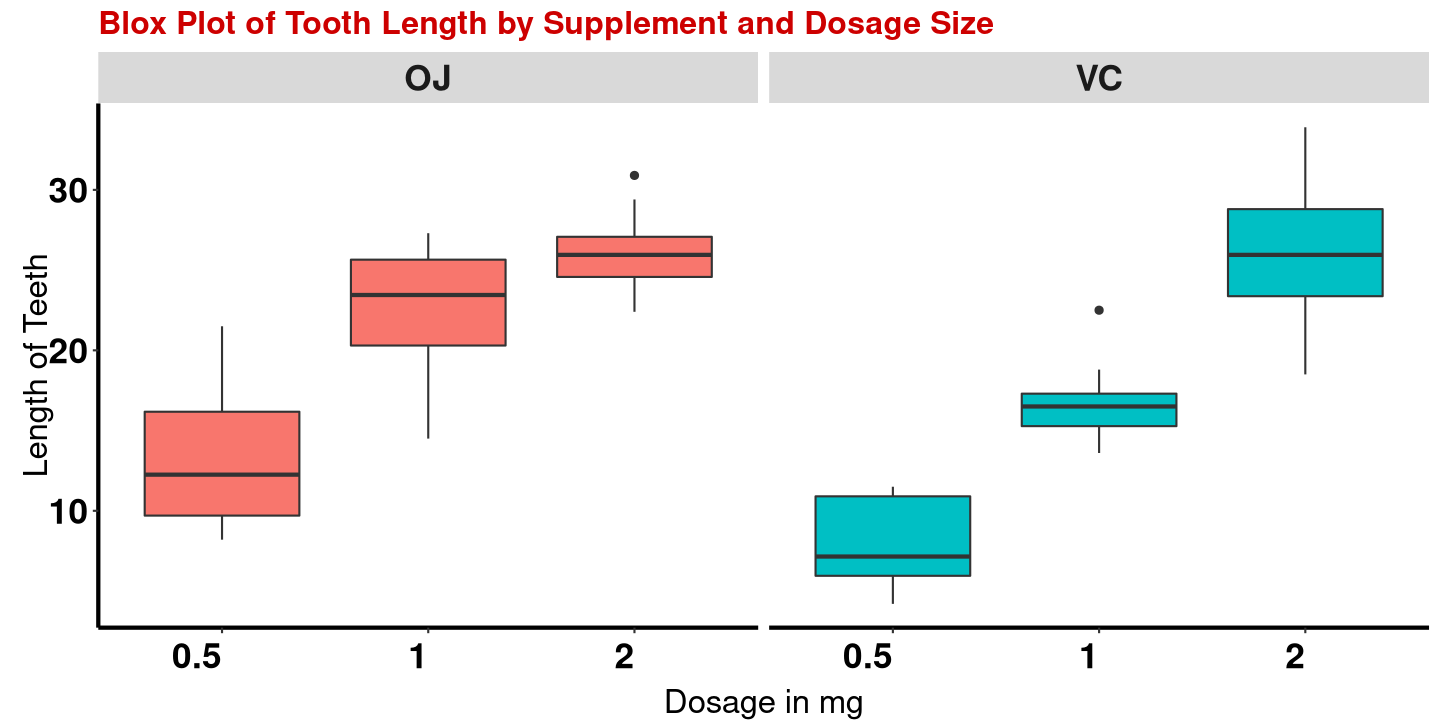
by( ToothGrowth$len, ToothGrowth$supp,mean)## ToothGrowth$supp: OJ
## [1] 20.66333
## --------------------------------------------------------
## ToothGrowth$supp: VC
## [1] 16.96333There is an observed difference, but is this difference statistically significant? In order to answer this question we will conduct a hypothesis test
Inference
Write the hypotheses for testing if there is a difference between the average tooth growth for guinea pigs given Orange Juice and those given Vitamin C.
Independent Two-Sample T-Test
- \(H_0: \mu_{OJ} - \mu_{VC}\) = 0 (Means outcome is same between group)
- \(H_A: \mu_{OJ} - \mu_{VC}\) != 0
Tooth Growth by Supplement type and Dosage size
(lowDosage <- t.test(len ~ supp,ToothGrowth[ToothGrowth$dose == .5, ]))
paste("For 0.5mg dosage p-value is",
      format(lowDosage$p.value, scientific=FALSE), ":reject NULL hypothesis", sep=" ")
##
## Welch Two Sample t-test
##
## data: len by supp
## t = 3.1697, df = 14.969, p-value = 0.006359
## alternative hypothesis: true difference in means is not equal to 0
## 95 percent confidence interval:
## 1.719057 8.780943
## sample estimates:
## mean in group OJ mean in group VC
## 13.23 7.98
##
## [1] "For 0.5mg dosage p-value is 0.006358607 :reject NULL hypothesis"(medDosage <- t.test(len ~ supp, ToothGrowth[ToothGrowth$dose == 1, ]))
paste("For 1mg dosage p-value is",
format(medDosage$p.value, scientific=FALSE), ":reject NULL hypothesis", sep=" ")##
## Welch Two Sample t-test
##
## data: len by supp
## t = 4.0328, df = 15.358, p-value = 0.001038
## alternative hypothesis: true difference in means is not equal to 0
## 95 percent confidence interval:
## 2.802148 9.057852
## sample estimates:
## mean in group OJ mean in group VC
## 22.70 16.77
##
## [1] "For 1mg dosage p-value is 0.001038376 :reject NULL hypothesis"(highDosage <- t.test(len ~ supp,ToothGrowth[ToothGrowth$dose == 2, ]))
paste("For 2mg dosage p-value is",
format(highDosage$p.value, scientific=FALSE), ":fail to reject NULL hypothesis", sep=" ")##
## Welch Two Sample t-test
##
## data: len by supp
## t = -0.046136, df = 14.04, p-value = 0.9639
## alternative hypothesis: true difference in means is not equal to 0
## 95 percent confidence interval:
## -3.79807 3.63807
## sample estimates:
## mean in group OJ mean in group VC
## 26.06 26.14
##
## [1] "For 2mg dosage p-value is 0.9638516 :fail to reject NULL hypothesis"Conclusion
Hypothesis tests
P-value < 5%: reject \(H_0\).
P-value > 5%: fail to reject \(H_0\).
Dosage of 0.5 mg or 1 mg: Since p-value is low(lower than 5%), we reject \(H_0\). These data do indeed provide convincing evidence that there is difference between the average length of tooth growth for guinea pigs given Orange Juice and those given Vitamic C. We can conclude that at these dosages Orange Juice promote tooth growth more than Vitamin C.
Dosage of 2 mg: Since p-value is high(higher than 5%), we fail to reject \(H_0\). These data do not provide convincing evidence that there is difference between the average length of tooth growth for guinea pigs given Orange Juice and those given Vitamic. We cannot conclude that high dosages of Orange Juice or Vitamin C promote tooth growth.
Confidence Intervals
If 95% interval for \(H_0: \mu_{OJ} - \mu_{VC}\) != 0: reject \(H_0\).
If 95% interval for \(H_0: \mu_{OJ} - \mu_{VC}\) = 0: fail to reject \(H_0\).
Dosage of 0.5 mg or 1 mg: 95% of random samples of 60 guinea pigs given a dosage of 0.5 mg or 1 mg Orange Juice OR Vitamic C will NOT yield confidence interval that contain similar true average length of tooth growth. We reject \(H_0\) because there is a difference in the means.
Dosage of 2 mg: 95% of random samples of 60 guinea pigs given a dosage of 2mg Orange Juice OR Vitamic C will yield confidence interval that contain similar true average length of tooth growth. We fail to reject \(H_0\) because there is no difference in the means.
Appendix
Conditions/Assumptions for Independent Two-Sample T-Test:
- Independence: Within groups: sampled observations must be independent with random sample/assignment. Between groups: the two groups must be independent of each other (non-paired)
- Sample size/skew: Each sample size must be at least 30(summary(ToothGrowth))
R Code
#Function for plotting histogram
plotbox <- function(box.data){
  ggplot(box.data, aes(x=factor(dose), y=len,fill=supp))+
  geom_boxplot()+ facet_grid(.~supp)+ labs(x="X (binned)")+
  theme(axis.text.x=element_text(angle=0, vjust=0.4,hjust=1,face="bold",
                                 color ="black", size =rel(2)),
        axis.title.x = element_text(size = rel(1.5),vjust= -.5),
        axis.text.y = element_text(face="bold", color="black", size =rel(2)),
        axis.title.y = element_text(size = rel(1.5), angle = 90,vjust=-.5),
        strip.text.x = element_text(size=rel(2),face="bold"),
        legend.position = "none", panel.grid.major = element_blank(),
        panel.background = element_rect(fill = "transparent"),
        axis.line = element_line(colour = "black", size=1, linetype = "solid"),
        plot.title = element_text(vjust= 1,lineheight=.8, face="bold",
                                  color="#CD0000", size=16))+
  scale_x_discrete("Dosage in mg") + scale_y_continuous("Length of Teeth") +
  ggtitle("Blox Plot of Tooth Length by Supplement and Dosage Size")
}